|
The evolution of the NSW Spatial Cadastre, commonly referred to as the DCDB (Digital Cadastral Data Base), is a remarkable story of digital transformation, from its initial inception to its present state as an essential component of the state’s digital infrastructure. The NSW Spatial Cadastre is a representation of all land parcel and property boundaries across the state, encompassing records of more than 4.5 million land parcels. In its current form it not only facilitates informed decision-making at various levels of government but also serves the wider community, promoting effective land management and governance. To achieve this, the state was divided into three divisions, each defined by a specific map scale used for each map sheet within that division. The sparsely populated Western division had a map scale of 1:100,000 with the Central division being more detailed at 1:50,000 and the more developed Eastern division more detailed again with a 1:25,000 scale. Map sheets were supplemented with more detailed maps (commonly 1:2,000 or 1:4,000) as required, typically for major towns and villages. The story of the NSW Spatial Cadastre begins with a patchwork of individual Crown and Deposited Plans, along with detailed charting maps of the state’s 141 counties, 7459 parishes and many others such as pastoral and town maps. In the 1960s, these diverse sources, ranging in scale from 1:1,000 to 1:100,000, were combined to create standardised map sheets of the entire State. |
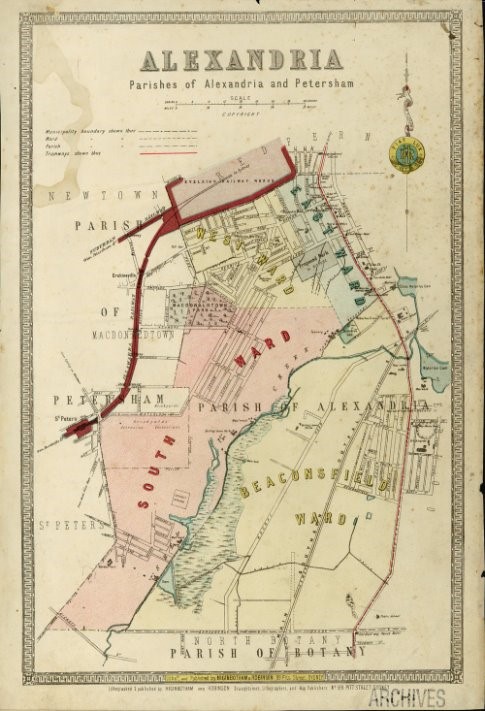
Image: Parish map of Alexandria and Petersham - reproduced with the permission of the Office of the Registrar General. |
Innovation in map sheet creation
The 'let-in method' was employed as an innovative technique at this time, used to combine maps for improved accuracy. In this process, a map image was layered under a scribe sheet made of light-blocking plastic. The scribe sheet displayed a printed image that outlined either topographic or cadastral features. To ensure precise spatial positioning, targets identified by our surveyors were employed, making it easier to correlate features visible in aerial imagery with those being mapped. As our cartographers worked with the scribe sheets, they meticulously aligned roads within designated road corridors, matched creeks to their respective waterways, and ensured that fence lines corresponded accurately with cadastral boundaries. This careful manipulation not only helped improve the accuracy of the maps but also enabled the adjustment of any errors to be spread between known points.

Image: Scribe tools were used to remove the scribe sheet coating over the required cadastral
topographic features that would later be printed.
Each map consisted of multiple layers of scribing sheets that represented a range of information from contours, roads, water, annotation, state forest and national parks in addition to cadastral land parcels. Once the scribing process was finished, the layers were aligned with registration pins to make one map sheet and then printed onto chromoflex, an opaque plastic material.
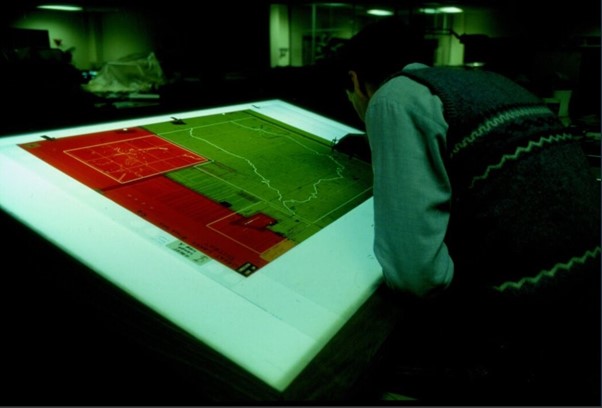
Image: Scribing with a light table – removal of scribe coating.
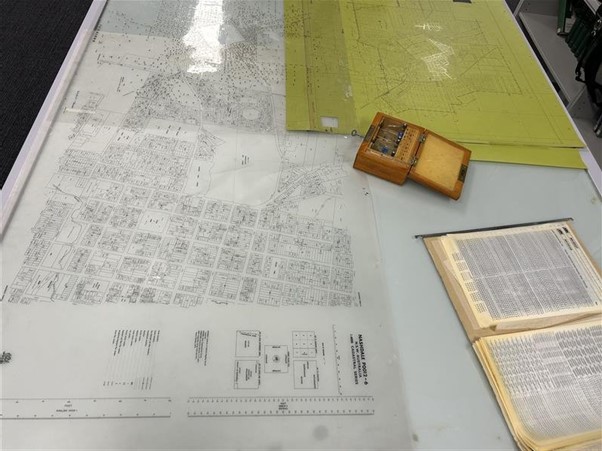
Image: Maps were printed on scribe coat and on chromoflex – an opaque plastic sheet.
The original scribe coat or chromoflex from the printed maps were kept and updated as new survey plans and gazettal information was received. The maps were updated using plotting or drafting machines that used vernier scale allowing the cartographer to get bearings within a five-minute accuracy and scale to measure the lines. The scale of the map had a significant bearing on the accuracy of the lengths of boundary lines. For example, at 1:25,000 each millimetre on the map represented 25 metres on the ground. Due to the techniques involved, especially the let-in method stage, accuracy was only guaranteed to half the map scale. Therefore, for a 1:25,000 map an acceptable error would be less than 12.5 metres. Unlike today, there was no link to any survey marks, so the position was based solely on topographic or occupation features (such as fencing).
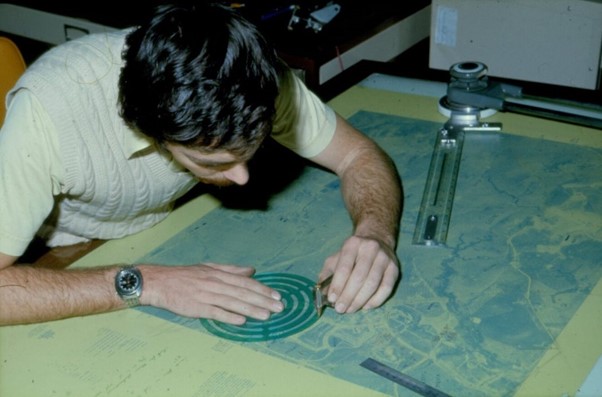
Image: The maps were updated using plotting or drafting machines that used vernier scale allowing the
cartographer to get bearings within a five-minute accuracy and scale to measure the lines.
Creating NSW Spatial Cadastre
From the late 1980s, following advancements in computer technology, the chromoflex map sheets were digitised to form the NSW Spatial Cadastre (or DCDB). Initially, a tracing digitisation method was used, where a 1:25,000 map was mounted onto an electronic board and crosshairs were placed over existing points. The co-ordinates of that point or line were then digitised into the computer. For a map at a scale of 1:25,000 map, the linework would be two to three meters thick on the ground, leading to potential errors depending on the crosshair’s placement. Some of the work was completed inhouse, however, during the trace digitisation project approximately 75 percent of the work was completed by private enterprise. The project aimed for a positional accuracy of digitisation being within 0.2 millimetres. In practice this meant that at 1:25,000 a 20-metre-wide road could become either 15 or 25 metres wide while still fitting within specifications. It took approximately a decade to complete the digitisation project and create the DCDB.

Image: Digitising the NSW Spatial Cadastre.
Why is the NSW Spatial Cadastre inaccurate?
Inaccuracies in the NSW Cadastre have developed over time due to several factors:
- Hand tracing: Original maps were created using hand tracing, scanning and other manual capture methods. Even slight deviations by cartographers with their tracing tools could cause a large displacement of the cadastre.
- Variable scales: Maps were drawn at different scales and combined, leading to inconsistencies.
- Material expansion: Temperature fluctuations affected the chromoflex used in map production causing the material to shrink or expand which caused distortion.
- Different map scales: Town maps were created independently from parish maps. When these maps were fitted together, they did not have matched scales, resulting in gaps or overlaps.
- Lack of survey control: There were no survey control or ground ties when the original maps were drawn and digitised.
It has only been with the introduction of digital imagery and survey marks that these inaccuracies are now seen.
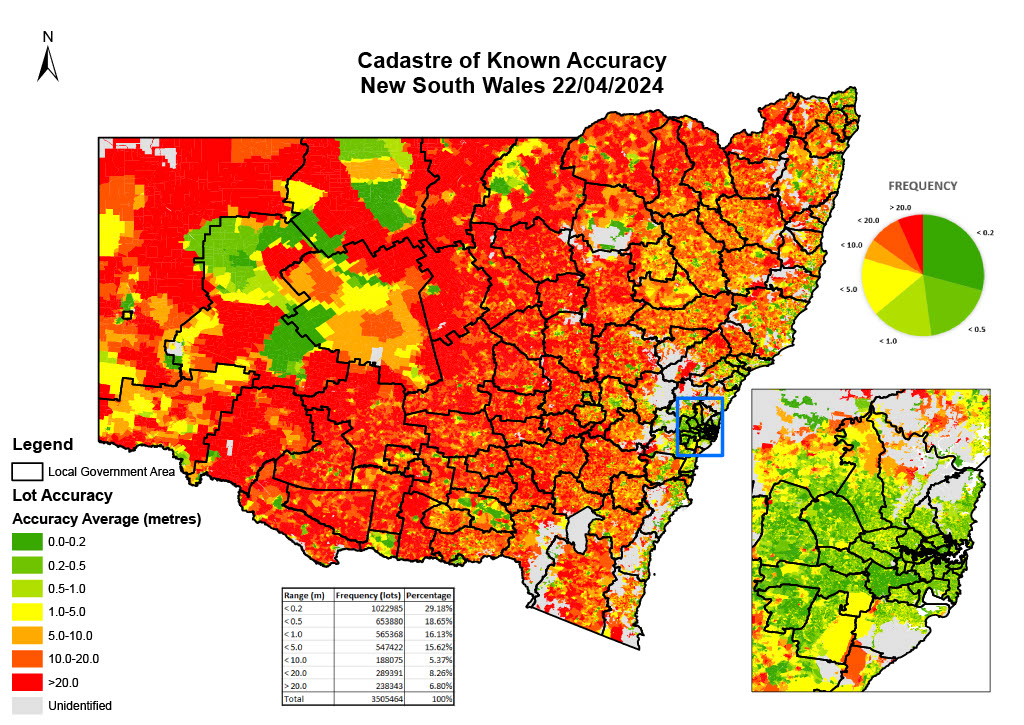
Image: Map displaying the estimated accuracy of the NSW Spatial Cadastre as of 2024.
DCS Spatial Services is custodian of the land parcel and property theme of the NSW Foundation Spatial Data Framework (FSDF) and under the Surveying and Spatial Information Act 2002, is responsible for maintaining the ‘State Cadastre’ on behalf of the Surveyor-General. In total, DCS Spatial Services has positionally improved more than 1.3 million parcels within the Spatial Cadastre across the state, ensuring improved accuracy within the NSW Cadastre which provides important data for government, industry and the community. Learn more here about our work in this space: https://www.spatial.nsw.gov.au/what_we_do/land_and_property_boundaries/cadastre

